The databases are represented by the notations, and the following notations are reduced to the collection of tables.
In the databases, every relationship or entity set can be denoted in the tabular forms.
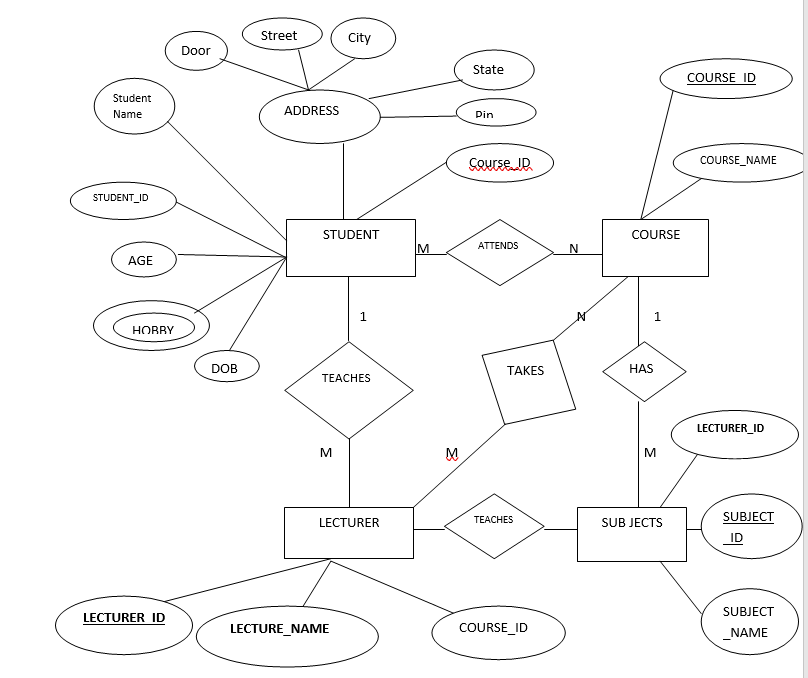
This is the ER diagram:

There are various points for the conversion of the ER diagram to the table:
- The respective Entity type becomes a table
According to the following ER diagram, COURSE, LECTURE, SUBJECT, and STUDENT forms their tables.
- Every attribute of a single value converts into a column for the table
In the entity of the STUDENT, the STUDENT _ID and STUDENT_NAME form the columns of the table of the STUDENT. In the same way, COURSE_ID and COURSE_NAME structure the columns of the COURSE table and so on.
- A separate table represents the multivalued attribute
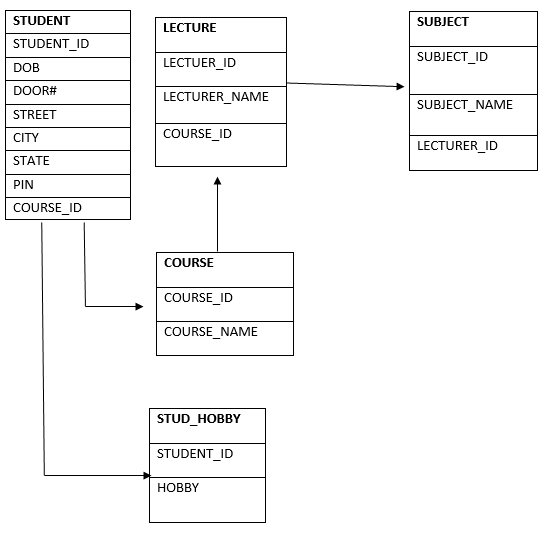
In the table of STUDENT, a Hobby is considered as a multivalued attribute. Hence, it is impossible to describe the multiple values in just a single column of the table of STUDENT. Therefore, we can make a table STUD_HOBBY under the name of HOBBY and STUDENT_ID. We can create a composite key by using both columns.
- The primary key represents the critical attribute of the entity type
In the following ER diagram, LECTURE_ID, STUDENT_ID, COURSE_ID, and SUBJECT_ID are considered as the key attributes of the entity.
- The components stand for the composite attribute
In the following ER Diagram, the student address stands for a composite attribute. It consists of PIN, STATE, STREET, CITY, and DOOR#. In the table of the STUDENT, the respective attributes can be merged in an individual column.
- The derived attributes are not included in the table
In the table of STUDENT, Age is considered as the derived attribute. The age can be calculated anytime by using the differences of the Date of Birth and the current date.
By applying these rules, you can easily assign mapping in the tables and change the ER diagram to columns and tables.
Following is the structure of the table for the ER Diagram:
