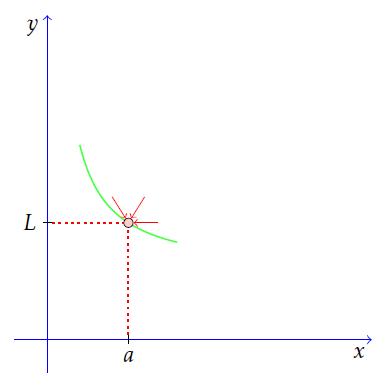
The concept of the limit of any function is the basis of all calculus. It is used to define derivation and integration, which form the basis of calculus. Consider a line on a graph where y= f(x). Here, when f(x) goes closer to a particular number L, x gets closer and closer to c from either side of the line, then L is the limit of f(x) as x approaches c. The behavior is expressed by writing:
$\lim _{x\to c}f(x)=L$

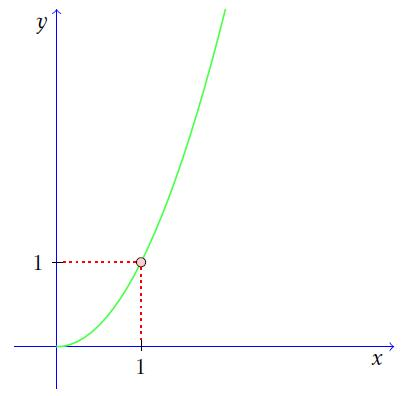
As the variable x approaches an on the graph above, the function f(x) approaches L.The limit of an actual function may look like the figure below where f (x) equals x2. As “x” approaches 1, f(x) approaches 1.

To express the function above we write:
$\lim _{x\to 1}x^{2}=1$
One-sided limits:

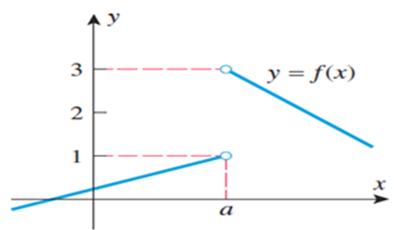
From the graph above, as you go from left to right and get closer to point a, notice that $\lim _{x\to a^{-}}f(x)=1$
Since y value is moving closer to 1 as x value is going closer to a from the left.
In general terms, the left-hand limit of f(x) as x approaches a from the left can be expressed as $\lim _{x\to a^{-}}f(x)=L$
We can assume the values of f(x) arbitrarily close to L by stating x < a. From the graph above, as you go from right to left and move closer to point a, notice that $\lim _{x\to a^{+}}f(x)=3$
Since y values are going closer to 3 as x value is going close to a from the right.
In general terms, the right-hand limit of f(x) as x approaches a from the right can be expressed as $\lim _{x\to a^{+}}f(x)=L$
We can assume the values of f(x) arbitrarily close to L by stating x > a.
Theorem: The 2 sided limit $\lim _{x\to a}f(x)=L$ exists if and only if the $\lim _{x\to a^{-}}f(x)=L$ and $\lim _{x\to a^{+}}f(x)=L$ exist and $\lim _{x\to a}f(x)=L$iff$\lim _{x\to a^{-}}f(x)=L$ and $\lim _{x\to a^{+}}f(x)=L$
All of the graphs below have the same one-sided limits and none of the two-sided limits exist. It does not matter what happens right at the value when determining limits.

Sometimes 1 sided or 2 sided limits fail to exist because the values of the function increase or decrease without bound. The +ive and -ive infinity (∞) are not real numbers, they describe specific ways in which the limits fail to exist.

Follow the graph above from left to right. As the x values get closer to 0, notice that: $\lim _{x\to 0^{-}}f(x)=-\infty $
Since y values are decreasing without abounding as x goes close to 0 from the left.
Follow the graph from right to left. As the x values get closer to 0, notice that: $\lim _{x\to 0^{+}}f(x)=+\infty $
Since y values are increasing without bound as x goes closer to 0 from the right.