It is quite simple, that when there are two variables in a linear inequality, it is addressed as linear inequality in two variables.
Graphical Solution of Linear Inequalities in Two-Variables
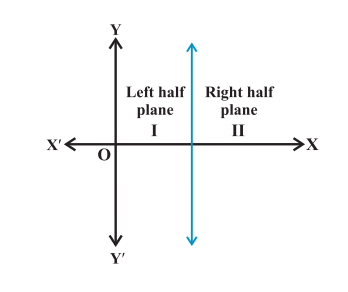
The solution of inequalities could be represented as the graph of inequalities. We are already known to the fact that a line tends to divide the two-dimensional Cartesian plane into two parts called halve-planes. As shown in the figure below, a vertical line divides the plane into the right and left halves.

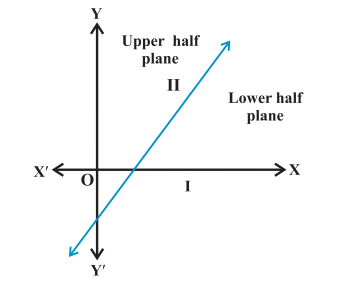
Also, a non-vertical line divides the Cartesian plane into lower and upper half as shown in the figure below:

Any point on the Cartesian plane is supposed to either:
- Lie in the line
- Lie within the half-plane – I; or
- Lie within the half-plane – II
In order to graph any linear inequality in two variables (consider $x$ and $y$), you would be required to first bring $y$ to one side. Further, consider a related equation that may be obtained by changing the prevailing inequality sign into equal sign. The graph of this equation is likely to be a line.
When the inequality is strict ($<$ or $>$), the graph for it would be a dashed line. Also, when inequality is not strict (≤ and ≥), the graph would depict a solid line.
Now, pick up one point that is not on the line; ((0,0) is generally the easiest); and make out whether or not these coordinates would satisfy the inequality. If it does, then shade the half-plane consisting of the point. If it doesn’t, then shade the other half.
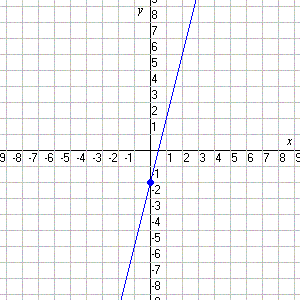
Consider graphing an inequality $y\le 4x-2.$
The line tends to be already in the slope-intercept form, with y on the left side alone. Its slope is 4 and the y-intercept for it is -2. Graphing it is therefore straight forward. Here, since we have a “less than or equal to” inequality, we would make a solid line.

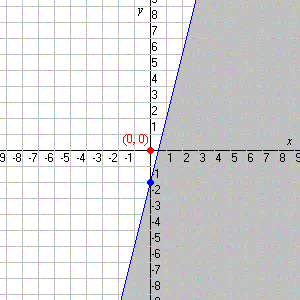
Now, consider substituting x=0, y=0; in order to decide whether (0, 0) could satisfy the inequality.
0 ≤ 4(0) – 2
0 ≤ – 2

Since this would be false, you will have to shade the half-plane which does not include the coordinates (0, 0).
With the help of above-explained theories, you may carry on with solutions and graphical representations of linear inequalities in two variables correctly and come up with the most appropriate solutions to these problems.